
Edit: An up-to-date description of the vans technology.
I’ve been monitoring battery status with a pair of Thornwave battery monitors. They work OK, but because they do not log data. I have to be within Bluetooth range to check the batteries. There is no history, so I have to guess what happened when I’m not around.
Ideally I could continuously log data from the battery monitors & upload the data to something always available – like a cloud. There is one commercial app (RV Whisper) that does what I want, but it requires a subscription. I want to do this on the cheap.
Cheap is also the reason why I don’t simply replace my Thornwave monitors with something like Victron monitors & use the Victron control panel and cloud to log and display data. That will work – but for what it would cost to purchase I could buy another $950 lithium battery and quit worrying about power.
So plan ‘A’ is to use what I got and get to where I want without spending real money.
Reading a Thornwave
A bit of Google Bing searching found someone who figured out how to slurp up data from Thornwave monitors via Bluetooth and make it visible in another monitoring application. So the hard part is done.
The next question is how to platform whatever I build. I thought hard about using an old Android phone. Power consumption is low, but scripting language options are few and not very capable. Without scripting, even simple application programming is a really heavy lift. Raspberry Pi’s draw very little power, run from an ordinary USB port, have a plethora of scripting languages available, and are only $29.
I had a day to kill last week so I ran over to MicroCenter, bought a $29 Pi 3B+, installed the default operating system and learned enough Python to be dangerous. Of course I had to re-remember how to use git and github. That took longer than learning python.
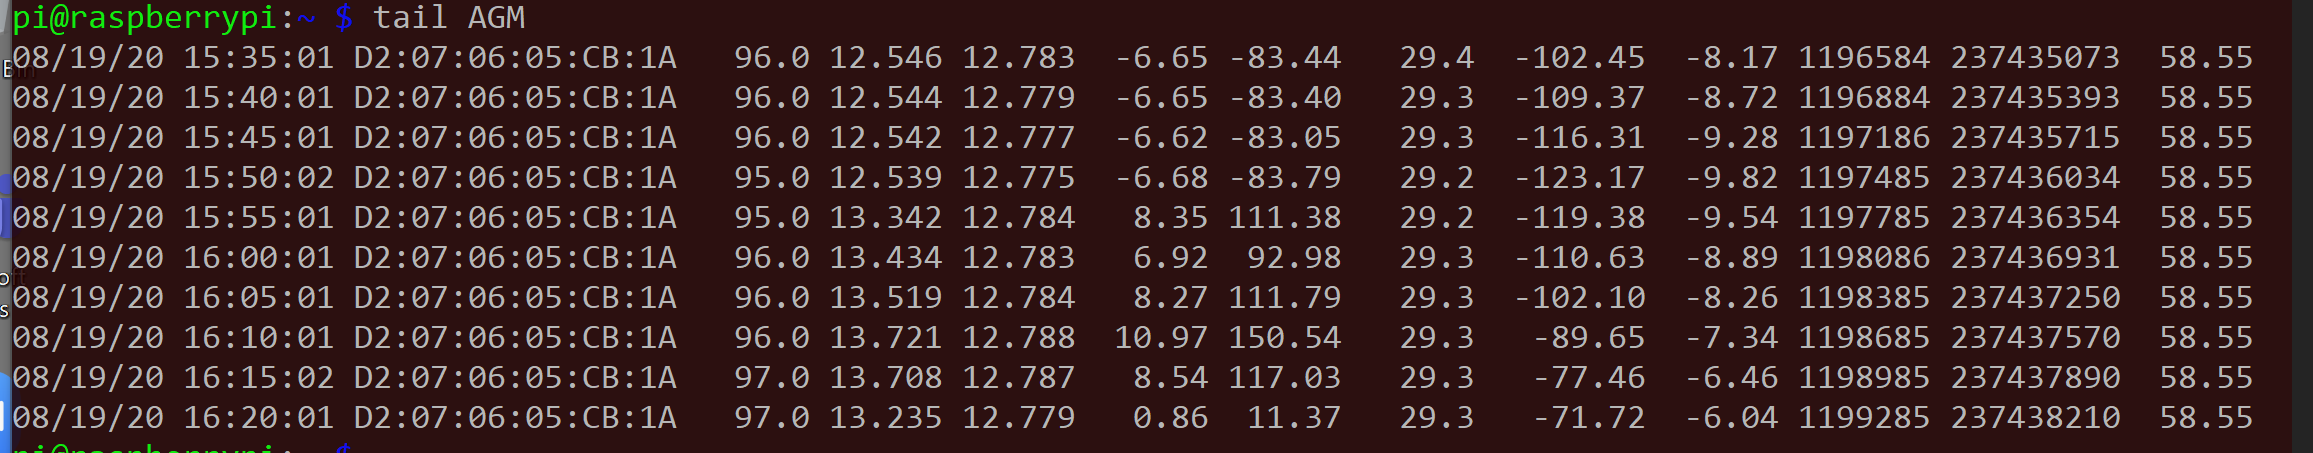
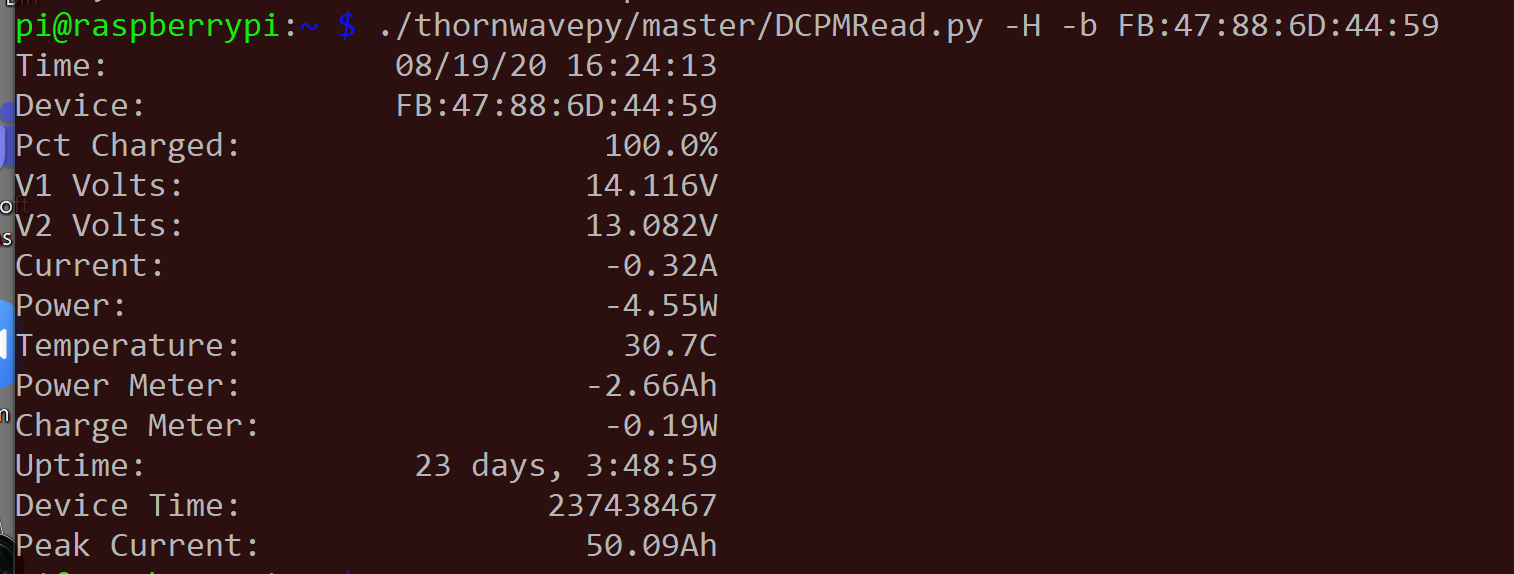
By the end of the day I had a skeleton of an app that could connect to a Thornwave via Bluetooth and read a dozen of the available sensors and data elements. A couple more days of part-time hacking and I had a python script that can read a Thornwave and output data in a couple of useful formats (human readable, tab delimited, and JSON) tested and checked into github and running on a Pi as a cron job every 5 minutes. This was fun because it’s been many years since I’ve written anything & I got to exercise a few rusted out brain cells.
Sample outputs:

The data will by much more useful if I can access it anytime, anywhere. To do that I set up the Pi so that I can SSH to it from anywhere using a reverse SSH tunnel from a cloud-hosted Linux server that I use for other projects. The Pi automatically SSH’s into the Azure cloud hosted server using autossh and creates a reverse TCP tunnel from the Azure server back to itself on port 22 (SSH). To access the Pi, I SSH to the Azure server and tunnel an SSH session from the Azure server back down to the Pi. I don’t need to know the IP address of the Pi or be on the same network and I don’t need to open any firewall rules on the hotspot that I keep in the camper.
Graphs, Charts and Clouds
I want some sort of visualization of the data. For me, a visualization is far better than raw data. I tossed around a couple of ideas and started out with (1) use good ‘ol RRDtool to store and graph the data, and (2) build a simple Azure Logic App that presents a JSON API to the Internet that inserts the data into something useful (like an Excel spreadsheet) that can chart the data.
RRDtool
RRDTool was the easiest to set up. I’d been using it for a couple of decades, so after an RRD refresher I wrote a python script that takes the output from my Thornwave script and inserts it into an RRD database. From that database I can generate a variety of charts & output them as PNG’s.
Here are a couple of examples – one showing battery voltage for both batteries and one showing current.

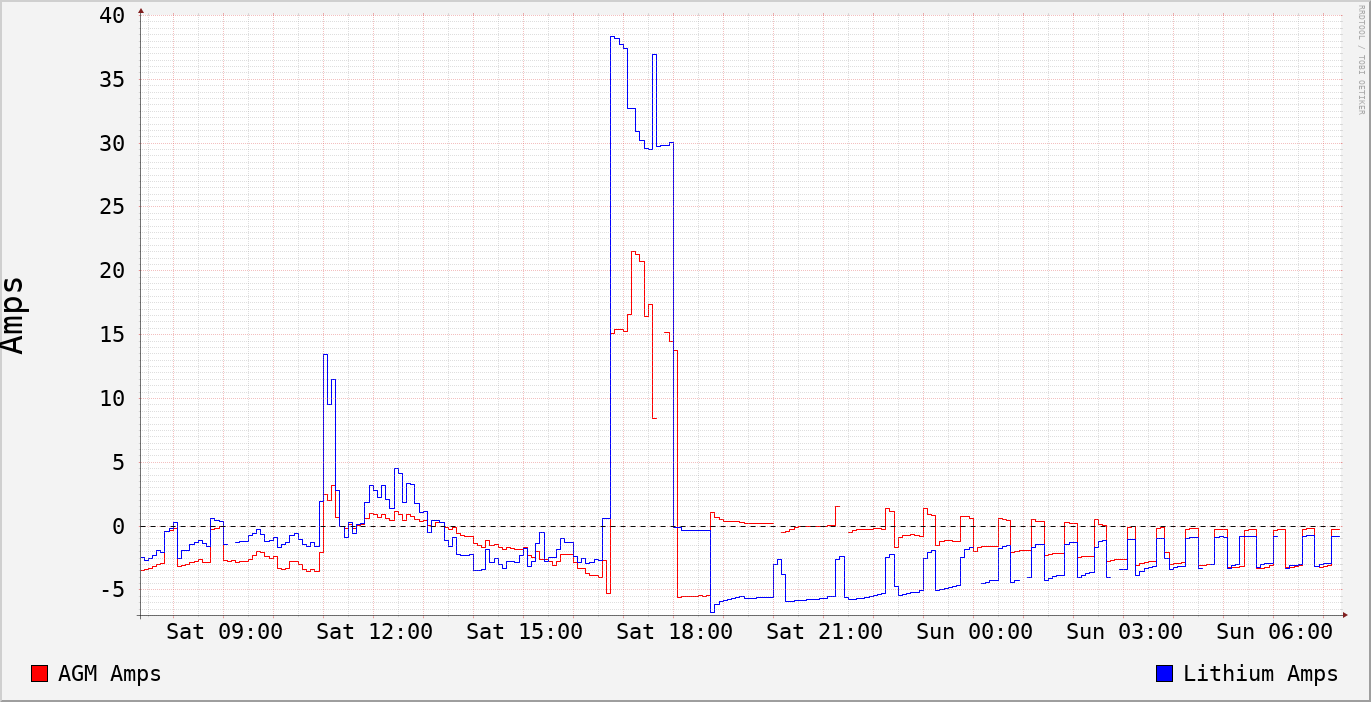
You can see on the left side of the graph where the solar panels tried to charge the batteries Saturday during the day, the center of the graph where I charged the batteries using wall power Saturday evening, and towards the right where the battery voltage dropped overnight as the batteries were depleted. You can also see the impact of the refrigerator cycling. The current draw increases (more negative) and voltage temporarily drops while the compressor draws current.
When I was charting this data, the lithium and AGM batteries were tied together with a Schottky diode – something that I’ll write about someday.
Azure Logic App
Setting up a Logic App wasn’t too difficult either. I used the Microsoft Graph API to ‘discover’ the location of my OneDrive hosted Excel spreadsheet and used the Azure GUI interface to create a Logic App that accepted JSON data and added it to the end of an Excel table. I wrote a python script takes the data from the Thornwave script, formats it as JSON, and calls the Logic App API. The rows show up in Excel every time they are generated on the Raspberry Pi and the formulas and charts in the spreadsheet automatically update as the data is inserted.
I now have dynamically updated charts any time I open up the spreadsheet. This works from desktops, phones, tablets, whatever.
Here’s a sample Excel graph showing roughly the same data as the RRDtool charts above. The annotations are added by me.

Enter Blynk
Jason, in his Everlanders YouTube channel has taken the art of camping with technology to an extreme, with Raspberry Pi’s, Arduino boards, and custom circuit boards, software and electronics. As in ‘OK Google, turn on the fan’. I’m not to the point of using microcontrollers to manage the camper (yet), but I did observe that the user interface to his technology is the IoT platform ‘Blynk‘
Blynk is easy to use and for simple projects, free. So along with the RRD and Azure Logic App/Excel data stores and charts, I decided to see if Blynk would make life easier. I wrote a python script that uploads the data from the Thornwave script to Blynk and used the Blynk android app to build a real-time dashboard with widgets for battery status in Amp-hours, battery status as a percent of full, and a real-time chart of battery voltage and current for both battery banks.
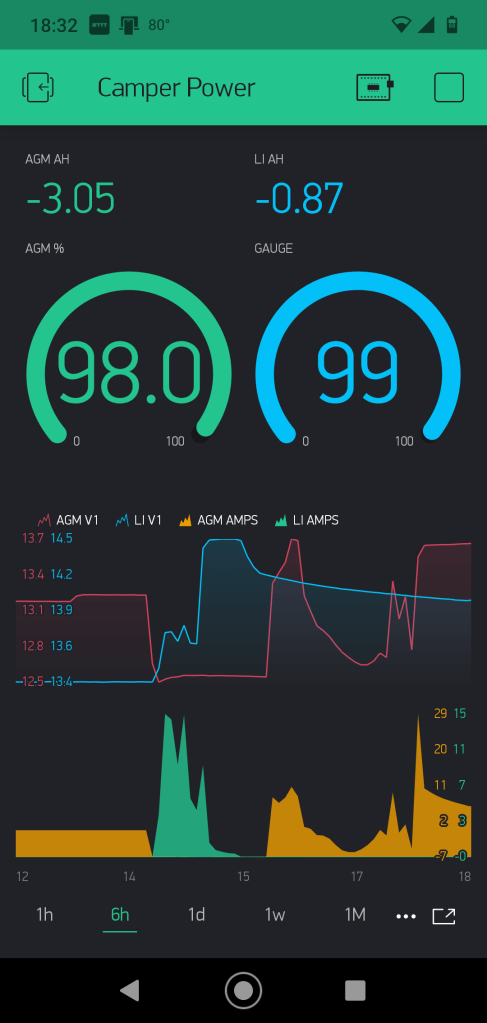
Blynk stores whatever data I send it in their cloud and the app uses their cloud as its data source, so I have real-time status anytime my phone is on any network.
I’m not sure which of the three systems I’ll maintain and use. Blynk is the prettiest, but without an expensive subscription its capabilities are limited. RRDtool is free but clunky. Logic APP + Excel is pretty heavy weight.

Leave a comment