RV’ers know that the OEM holding tank gauges are unreliable and inaccurate. At best, they only indicate levels to the nearest quarter of a tank. At worst they read random values unrelated to the fluid level in the tanks. This can be fixed though. Garnet Instruments makes reliable tank gauge kits with sending units that attach to the outside of the tanks and a control panel to read the tank levels.
Normal people buy Garnet’s SeeLevel sending units with the appropriate SeeLevel control panel. If they want to integrate their gauges into their camper’s monitoring system, they buy the versions with RV-C or NMEA2000 interfaces and use those interfaces to integrate with their camper’s systems.
This post was not written by a normal person.
Info on how to read the data from the SeeLevel sending units without the control panel is scarce. I found a single thread from a few years ago on a Raspberry Pi forum, where “Jim G” wrote a couple of posts describing how he decoded the digital signals from the sending units without a control panel. His posts had enough detail to recreate what he did using an ESP32 microcontroller and a few discrete components. You can check out his posts in this thread.
The short description of the digital signaling needed to trigger and read a sending unit is (roughly):
- Power the sending unit with 12V.
- Trigger a read by pulsing the power to ground an appropriate number of times, depending on which sensor you want to read.
- Wait for the sending unit response – a series of 96 pulses to ground. The pulses represent 96 bits (12 bytes) of data, one byte per sending unit segment, plus a few other bytes.
- Interpret the sending unit’s segment values at ‘percent full’ for each segment and use that data to estimate the ‘percent full’ then the whole tank.
A bit more detail is in Jim D’s post (linked above) and my GitHub account.
Experimentation
I started out experimenting with a single sending unit, a water jug, a basic level-shifting circuit, and a bit of code on an ESP32. From that it was clear that this might work, and more importantly – it gave me an excuse to buy a cheap logic analyzer.
The circuit designed by Jim G. from the Raspberry Pi forum turned out to be better than my own, so I adopted it with minor modifications and expanded the test to include three sending units (fresh, grey and black water, all fastened to the same water jug). My logic analyzer was good enough to tell me that the circuit was working, but not good enough to tell me how well it was working. Not wanting to pass on a perfect excuse to buy an oscilloscope, I sourced a Rigol DHO804 for my test bench.
Using the logic analyzer and oscilloscope, I was able to tweak Jim G’s circuit a bit, verify that the signals returned were valid and that the sending units would respond when at the far end of 20ft. of 20ga. wire.


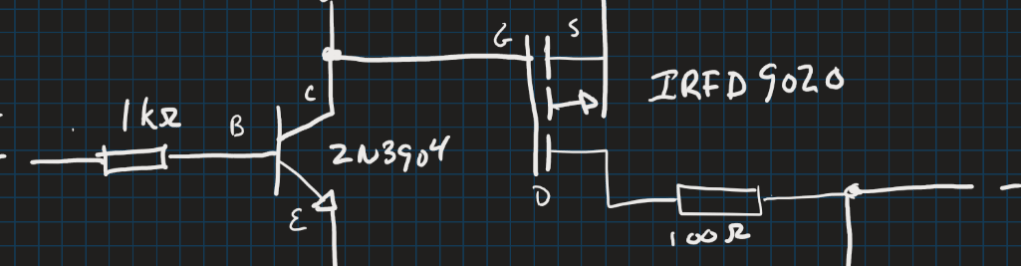
Here’s the circuit I ended up with:
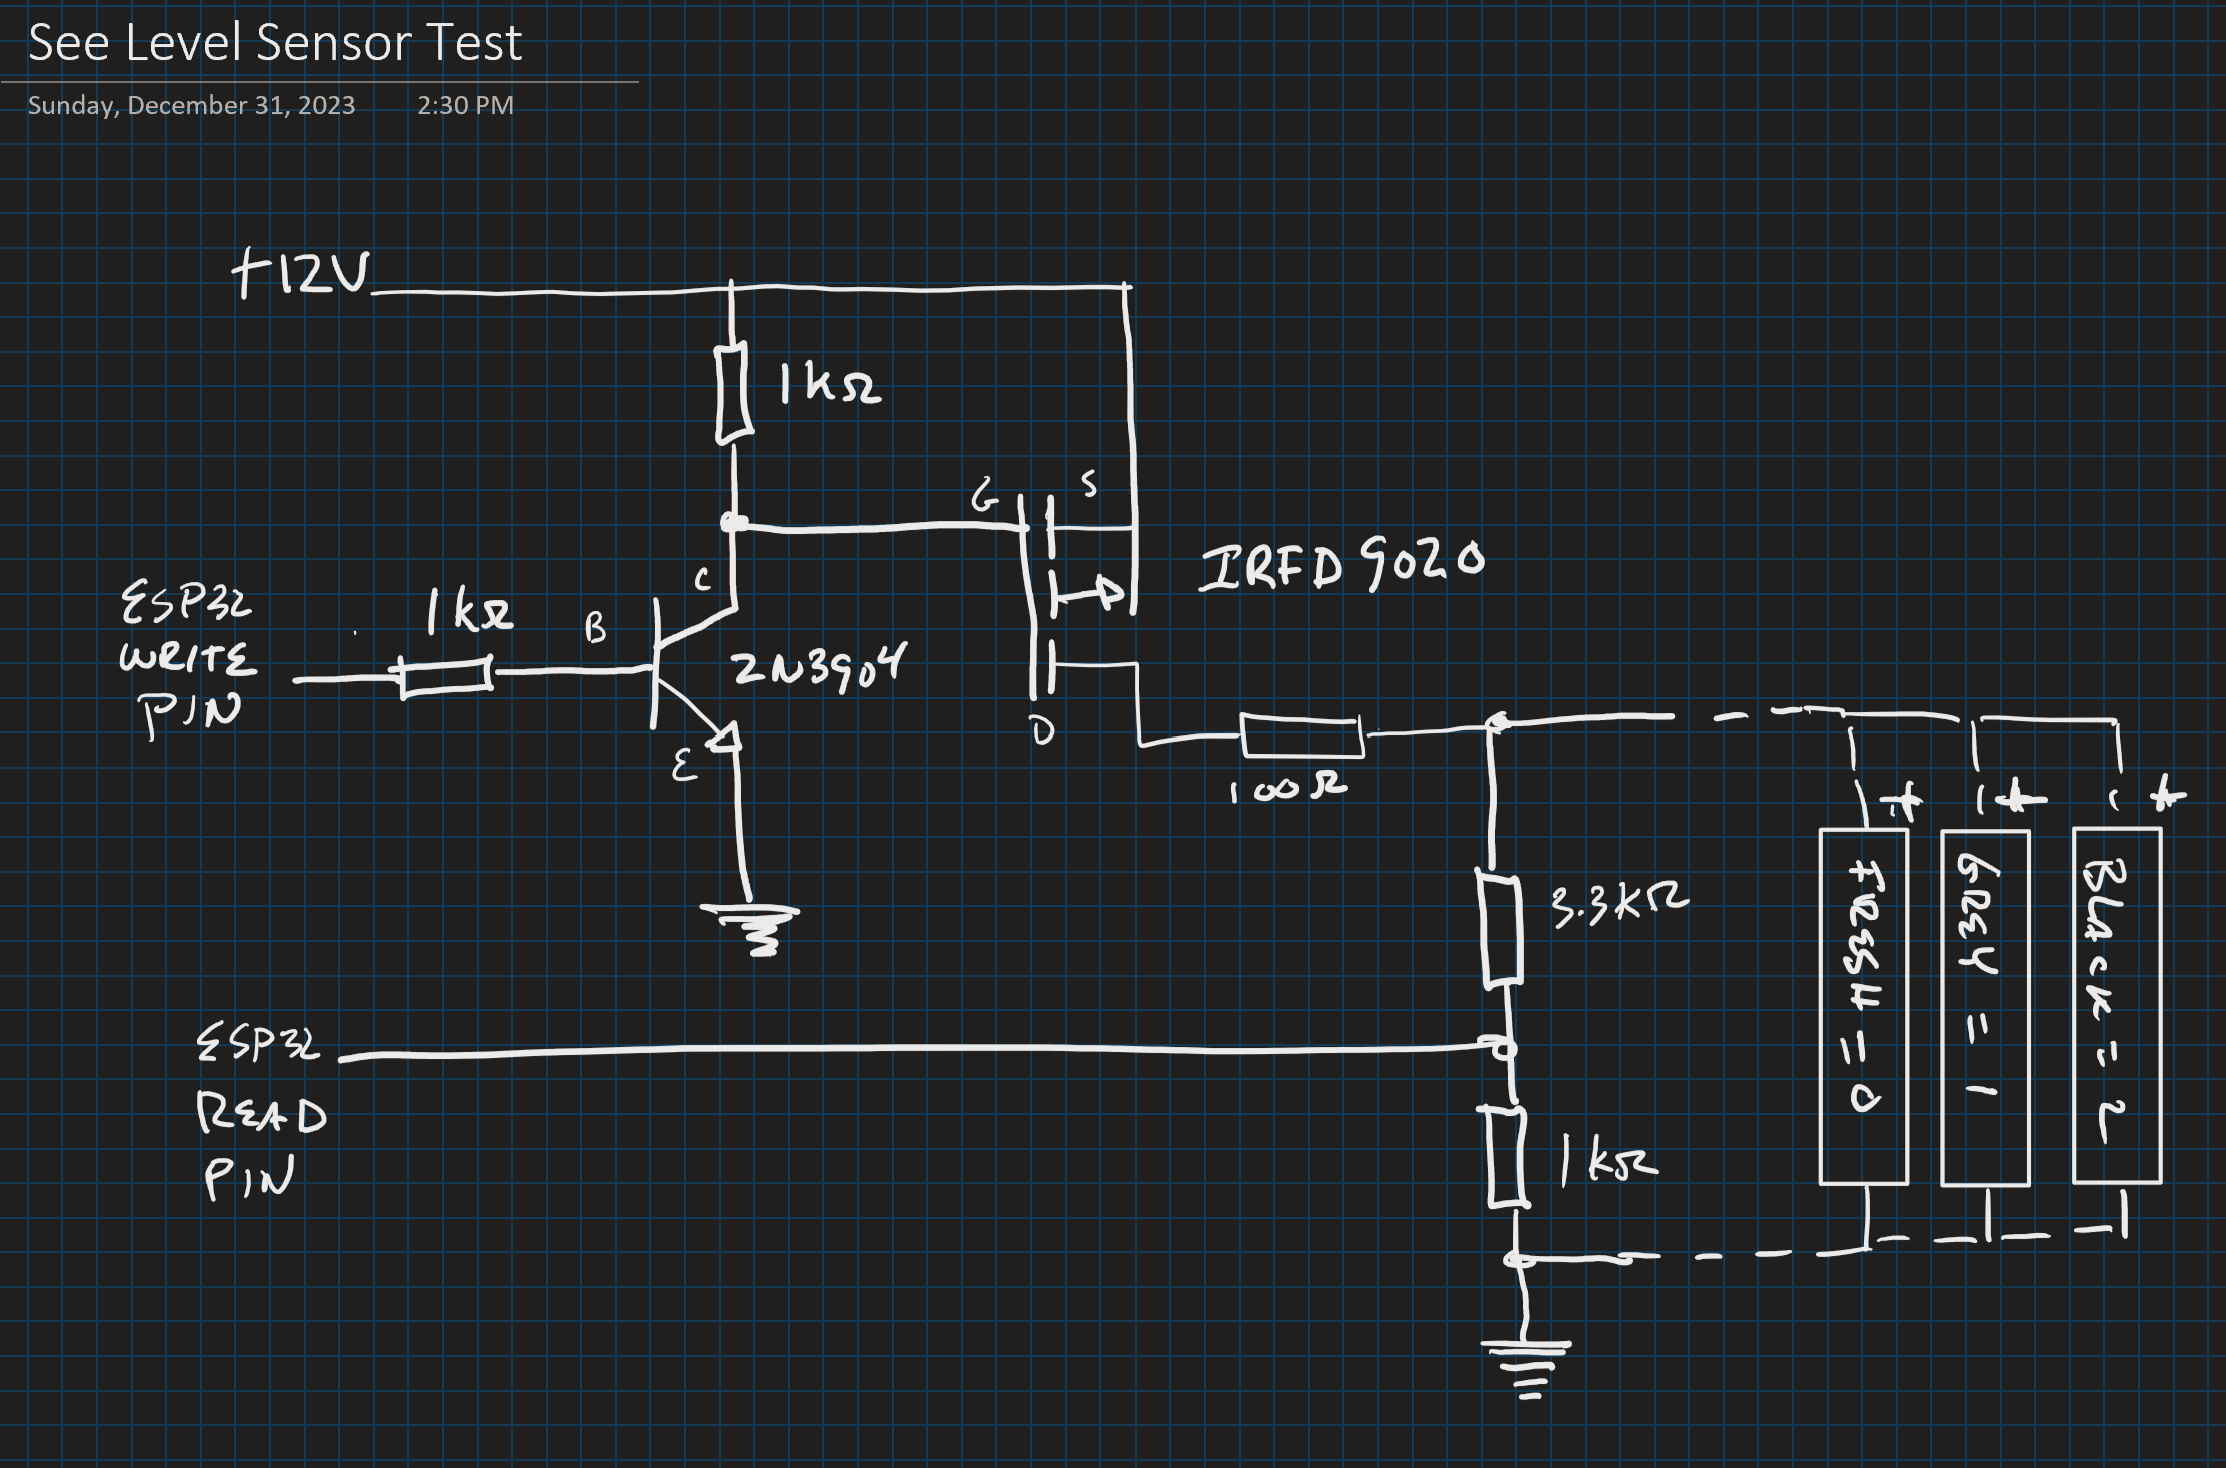
So far, so good. Or at least good enough to melt some lead.
I used an M5Stack-S3 ESP32 microcontroller socketed to a small breadboard. Descriptions of how to communicate with the sending units, a circuit diagram, and sample code are posted to my GitHub account.

Integrating into the camper
I followed my normal practice of forwarding data from whatever I’m measuring to ESP-NOW, where it gets picked up as an MQTT message, sent to Node-Red, and from there to wherever I think it might be useful (Described here). In this case, ‘useful’ would be the Nextion screen in my camper and the Blynk IoT app on my phone.

The IoT app was easy – one gauge for each tank. I figure a read every 15 minutes would be adequate, except when filling the freshwater tank, where near-real-time would be nice. An ‘update-now’ button for each tank solves that problem.
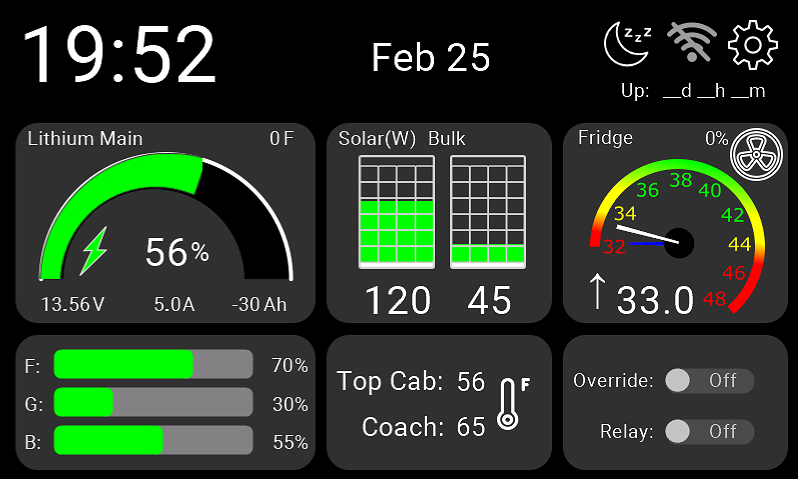
For the in-camper Nextion display, I have to decide how to show the tank levels. I have room in the lower-left corner of the display. One option is to show tank levels as ordinary green bars, labeled appropriately:
Or I could use emoji to represent the contents of the tanks, where 💧’s, 🚿’s and💩’s graphically represent both the levels and contents of the fresh, grey and black tanks:
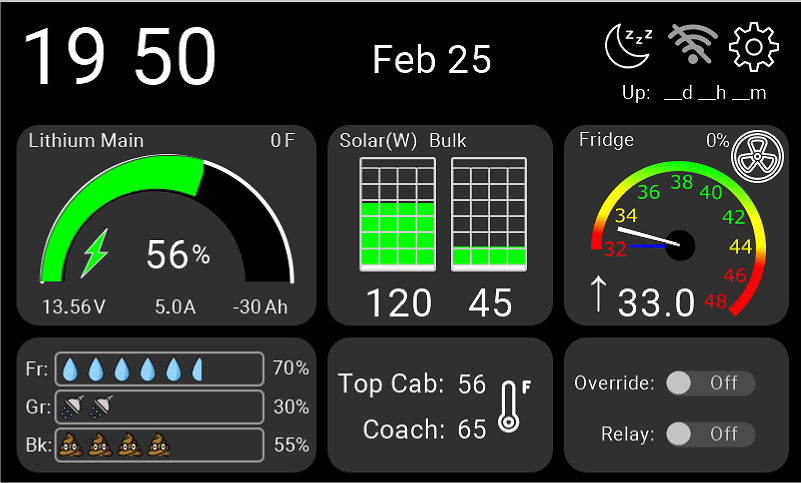
🤣
Using💩emoji to represent the number of 💩’s in the black tank (or perhaps the number of 💩’s remaining) might be a bit too much. Because the emoji are discrete units, the implication is that the gauges are calibrated in ‘number of 🚿’s’ or ‘number of💩’s’. If I use this version, I’d have to come up with a 💩 and 🚿 calibration routine of some sort.
Sounds complicated. I suspect I’ll go with the boring green-bar gauges.
The whole mess isn’t installed in the camper yet – even in the middle of the warmest winter on record, it’s still too cold to attach the sending units to the tanks. So for now I’m measuring the water level in the water jug on my bench every 15 minutes.
Code for a fleshed-out ESP32 app is also posted to GitHub.

Leave a comment